Domain Summary
Follow the steps mentioned below to view the Domain Summary page:
-
Select Classes on the top navigation menu and select a class.
-
Select Data on the left navigation pane, and Results by Assessment appears by default. The Diagnostic growth report section displays the report title and program name for the list of available growth reports.
-
Select the required growth report and select the Domain Summary tab on the left pane to view the Domain performance breakdown card.
Domain performance breakdown
-
Select one of the available reports - Beginning of Year, Middle of Year, and End of Year from the drop-down list.
By default, the most recent administration is displayed.
-
Hover over any segment of the horizontal bar chart to display the pop-up menu that shows the students and their scores.
-
Select View Report to display the latest student report for the selected student.

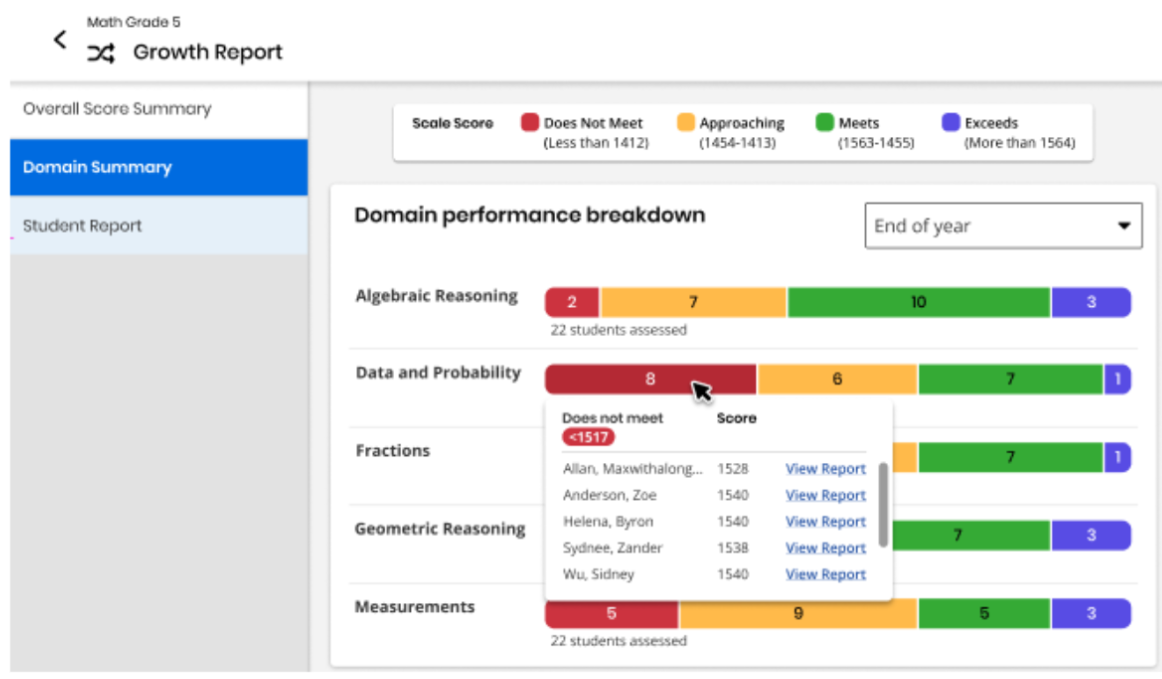
The card is intended to help teachers understand how their class performs across particular domains.
-
To access student data, teachers can hover over the segment of the domain performance bar and view the students that tested into that range.
-
Teachers can view a student's report by selecting on View Report in the pop-up menu.
-
The legend on top displays the performance band ranges.
-
Teachers can use the drop-down to select which report to see (End of Year, Middle of Year, or Beginning of Year).
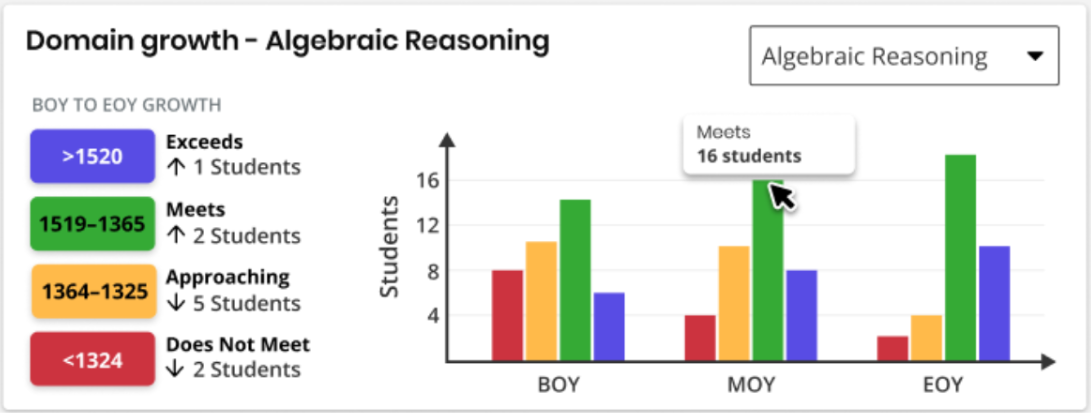
Domain Growth
This page allows teachers to view how the number of students in each performance band changes over time by domain. They can select the domain in the drop-down.
Teachers can hover-over on the bar graphs to view the performance band represented by the bar and the number of students in that domain. They can also view how the number of students in each domain has changed since from the BOY to EOY.
See Also