Student Report
Follow the steps mentioned below to view the Student Report page within the Momentum Growth Report:
-
Select Classes on the top navigation menu and select a class.
-
Select Data on the left navigation pane, and Results by Assessment appears by default.
The Diagnostic growth report section displays the report title and program name for the list of available growth reports.
-
Select the required growth report and select Student Report on the left pane.
Overall Score
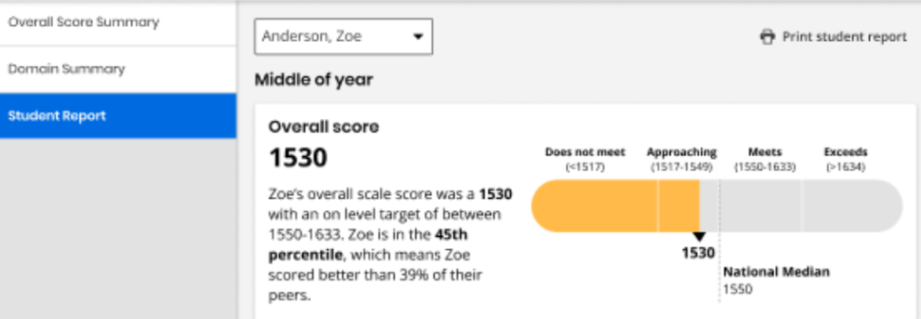
By default, Realize will display the most recently-taken diagnostic assessment. You can view older reports in the Data tab. The Overall Score (scale score) displays the student's overall scale score and their national percentile ranking for the assessment. The scale to the right displays where the student's performance lies within score ranges for Does Not Meet, Approaching, Meets, and Exceeds expectations. If your account is on the latest Momentum Math release, a toggle appears at the top of the Student Report. Use it to switch between viewing results by Scale score or Quantile® measure.
Only those students who completed a diagnostic appear in the drop-down list at the top of the page.
Scale Score Example
A given scale score has the same meaning across grade levels. For example, a scale score of 1510 on the Level A Diagnostic (Kindergarten) reflects the same performance as a scale score of 1510 on a Level B Diagnostic (Grade 1). If a student earns 1510 in Kindergarten and 1560 in Grade 1, then their math performance increased by 50 scale score points.
Student Growth Score
-
Use the dropdown at the top of the Student growth card to switch between Overall performance and a specific Domain.
-
Select or de-select the Show class average checkbox to show or hide the class average line chart.
-
Select or de-select the Show growth checkbox to show or hide the student's growth line and score markers.

-
Hover over any data point to see the exact value and its associated performance level. Hover over the x-axis labels BOY, MOY, EOY to see the full terms in a tool tip (Beginning of Year, Middle of Year, and End of Year).
-
The growth tooltip shows the point difference between the first and most recent score.
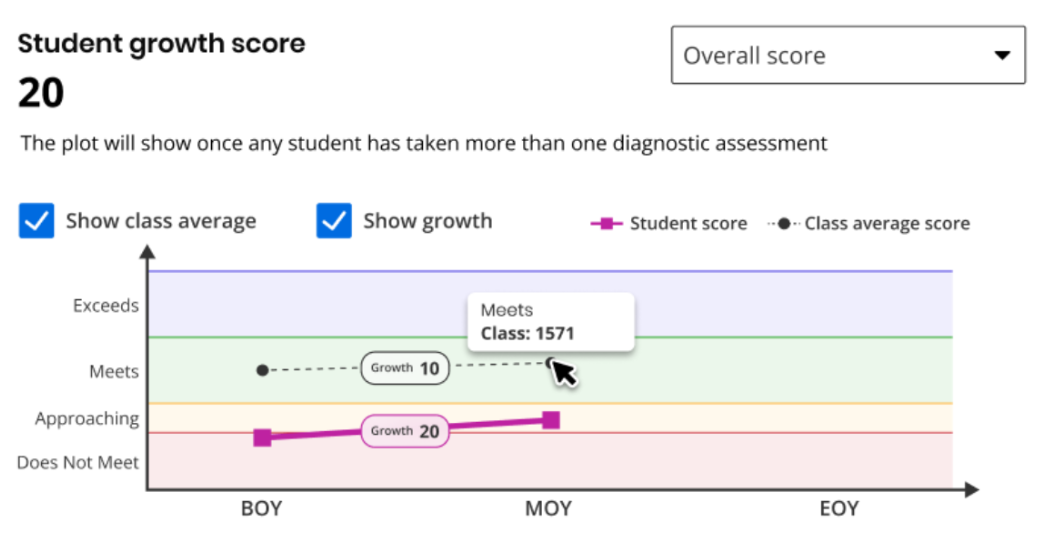
If scores overlap in the line graph, then the class average score displays above the student score.
When depicting growth visualization, using percentiles looks different than with constant scale scores.
Performance by Domain
-
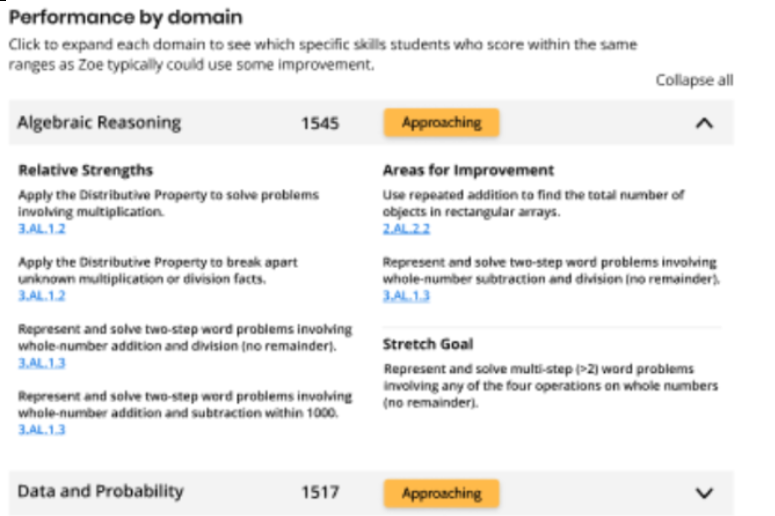
Use the Performance by domain card to view the student's scale score for each domain in the assessment, along with their performance level for that domain. Selecting a domain displays the skills the student has mastered (Relative Strengths), skills to target for improvement (Areas for Improvement), and a Stretch Goal. Due to the adaptive nature of the Diagnostics, not all domains have scale scores, and students with very high or very low domain scale scores may not have Relative Strengths or Stretch Goals.
-
Select a standard to view assignable resources aligned to that standard.
-
To print the complete report, select Print student report.

For more details on scale scores, percentiles, Quantile measures, and interpretation, please refer to the User Guide in the Getting Started folder.
Quantile Measures
If available, Quantile measures place students and math skills on the same scale, indicating a student’s mathematical readiness and the difficulty of specific skills or concepts. Momentum reports Quantile measures in both Diagnostic and Growth Reports. Educators can use the skills database on the Quantile Hub (by MetaMetrics®) to look up measures aligned to any state standard. Comparing a student’s Quantile measure to a skill’s Quantile measure supports data-informed instruction. Close matches suggest appropriate next steps, while larger gaps point to needed scaffolds or enrichment.
To access Quantile measurements, select the Quantile measure tab. You can see an example of the Quantile measure tab below:
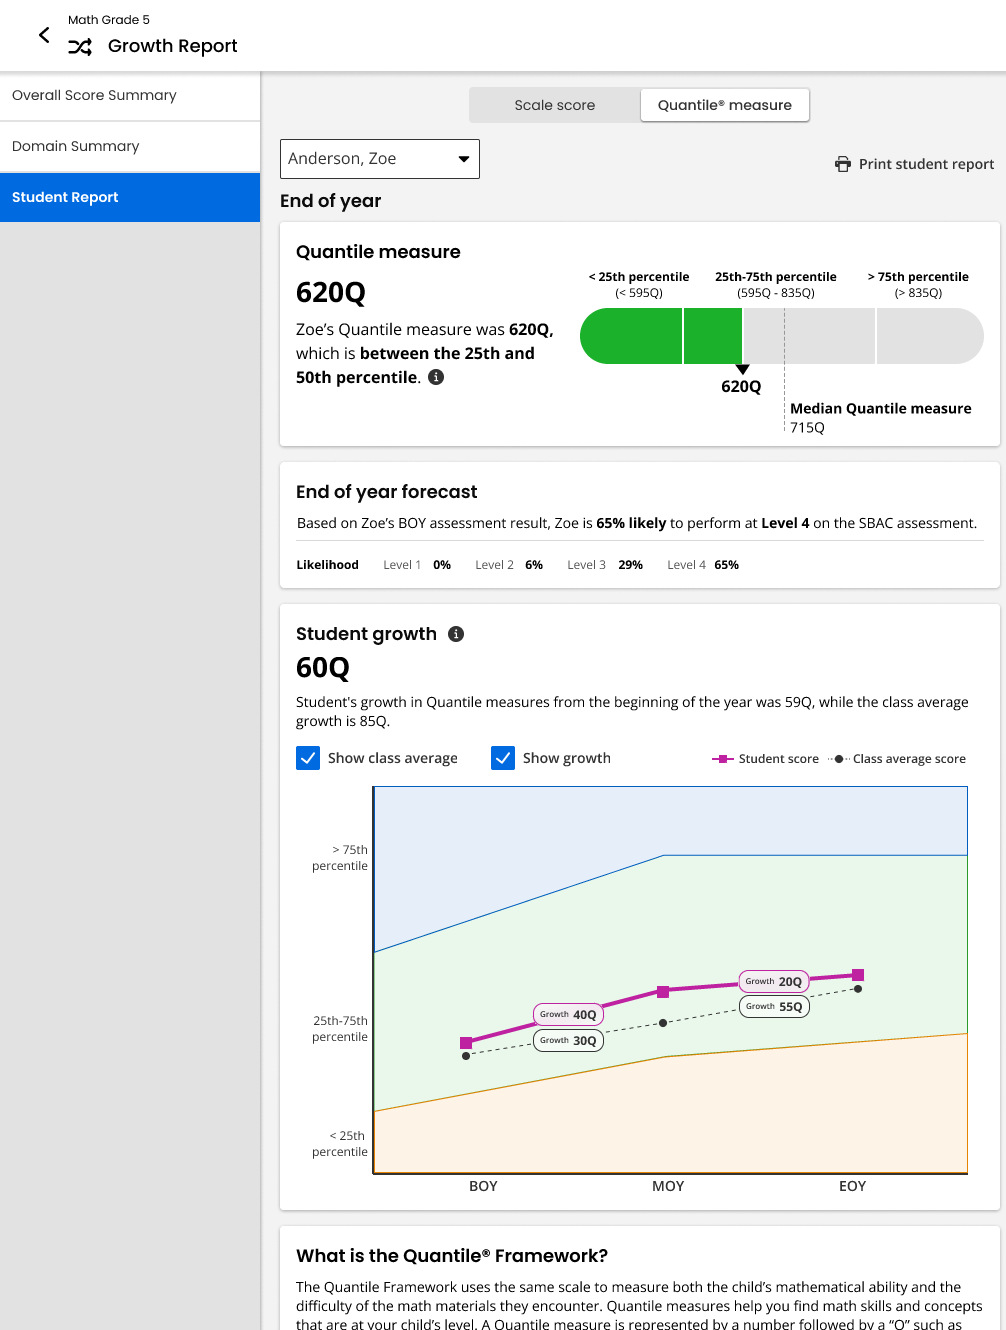
When viewing the Student Report with Quantile measures toggled on, multiple cards can appear: Quantile measure, End of year forecast, and Student growth.
The top card displays the student’s overall performance as a Quantile measure, as well as a comparison to their peers, represented as national percentile ranges. When reviewing results as Quantile measures, note that a student’s Quantile measure (based on MetaMetrics norms) may yield a different percentile than their Savvas scale score. This is expected because each score uses different norming groups. For that reason, it’s best to triangulate: look at multiple measures together. If they tell a consistent story, you can be more confident in your conclusions.
End of Year Forecast
In the middle of the Student Report is the End of Year forecast card, based on all diagnostic assessments submitted thus far, and including estimates about how students are likely to perform by the end of the school year. The End of Year forecast is predicting either supported state tests as shown in the map here, or the Momentum Math EOY Diagnostic. For example, in Washington state, students take SBAC, but not for grades K-2. So their End of Year forecast would include the likelihood that a student will perform at different levels either on the Momentum Math EOY (K-2) or SBAC (all others).
End of Year forecasts are reported as performance levels with associated likelihoods. Even though the End of Year forecasts become more accurate as students progress through the year, treat them as planning guides and not guarantees. Individual outcomes can change with instruction, practice, and other supports, and students may outperform forecasts. Use these projections alongside ongoing classroom evidence and professional judgment.
Student Growth
Student growth displays the difference in Quantile measures over the course of the school year.
Select Print student report to print out a copy of this report.
For more information about Quantile measurements, see the Lexile® and Quantile Hub webpage.
See Also