Dashboard
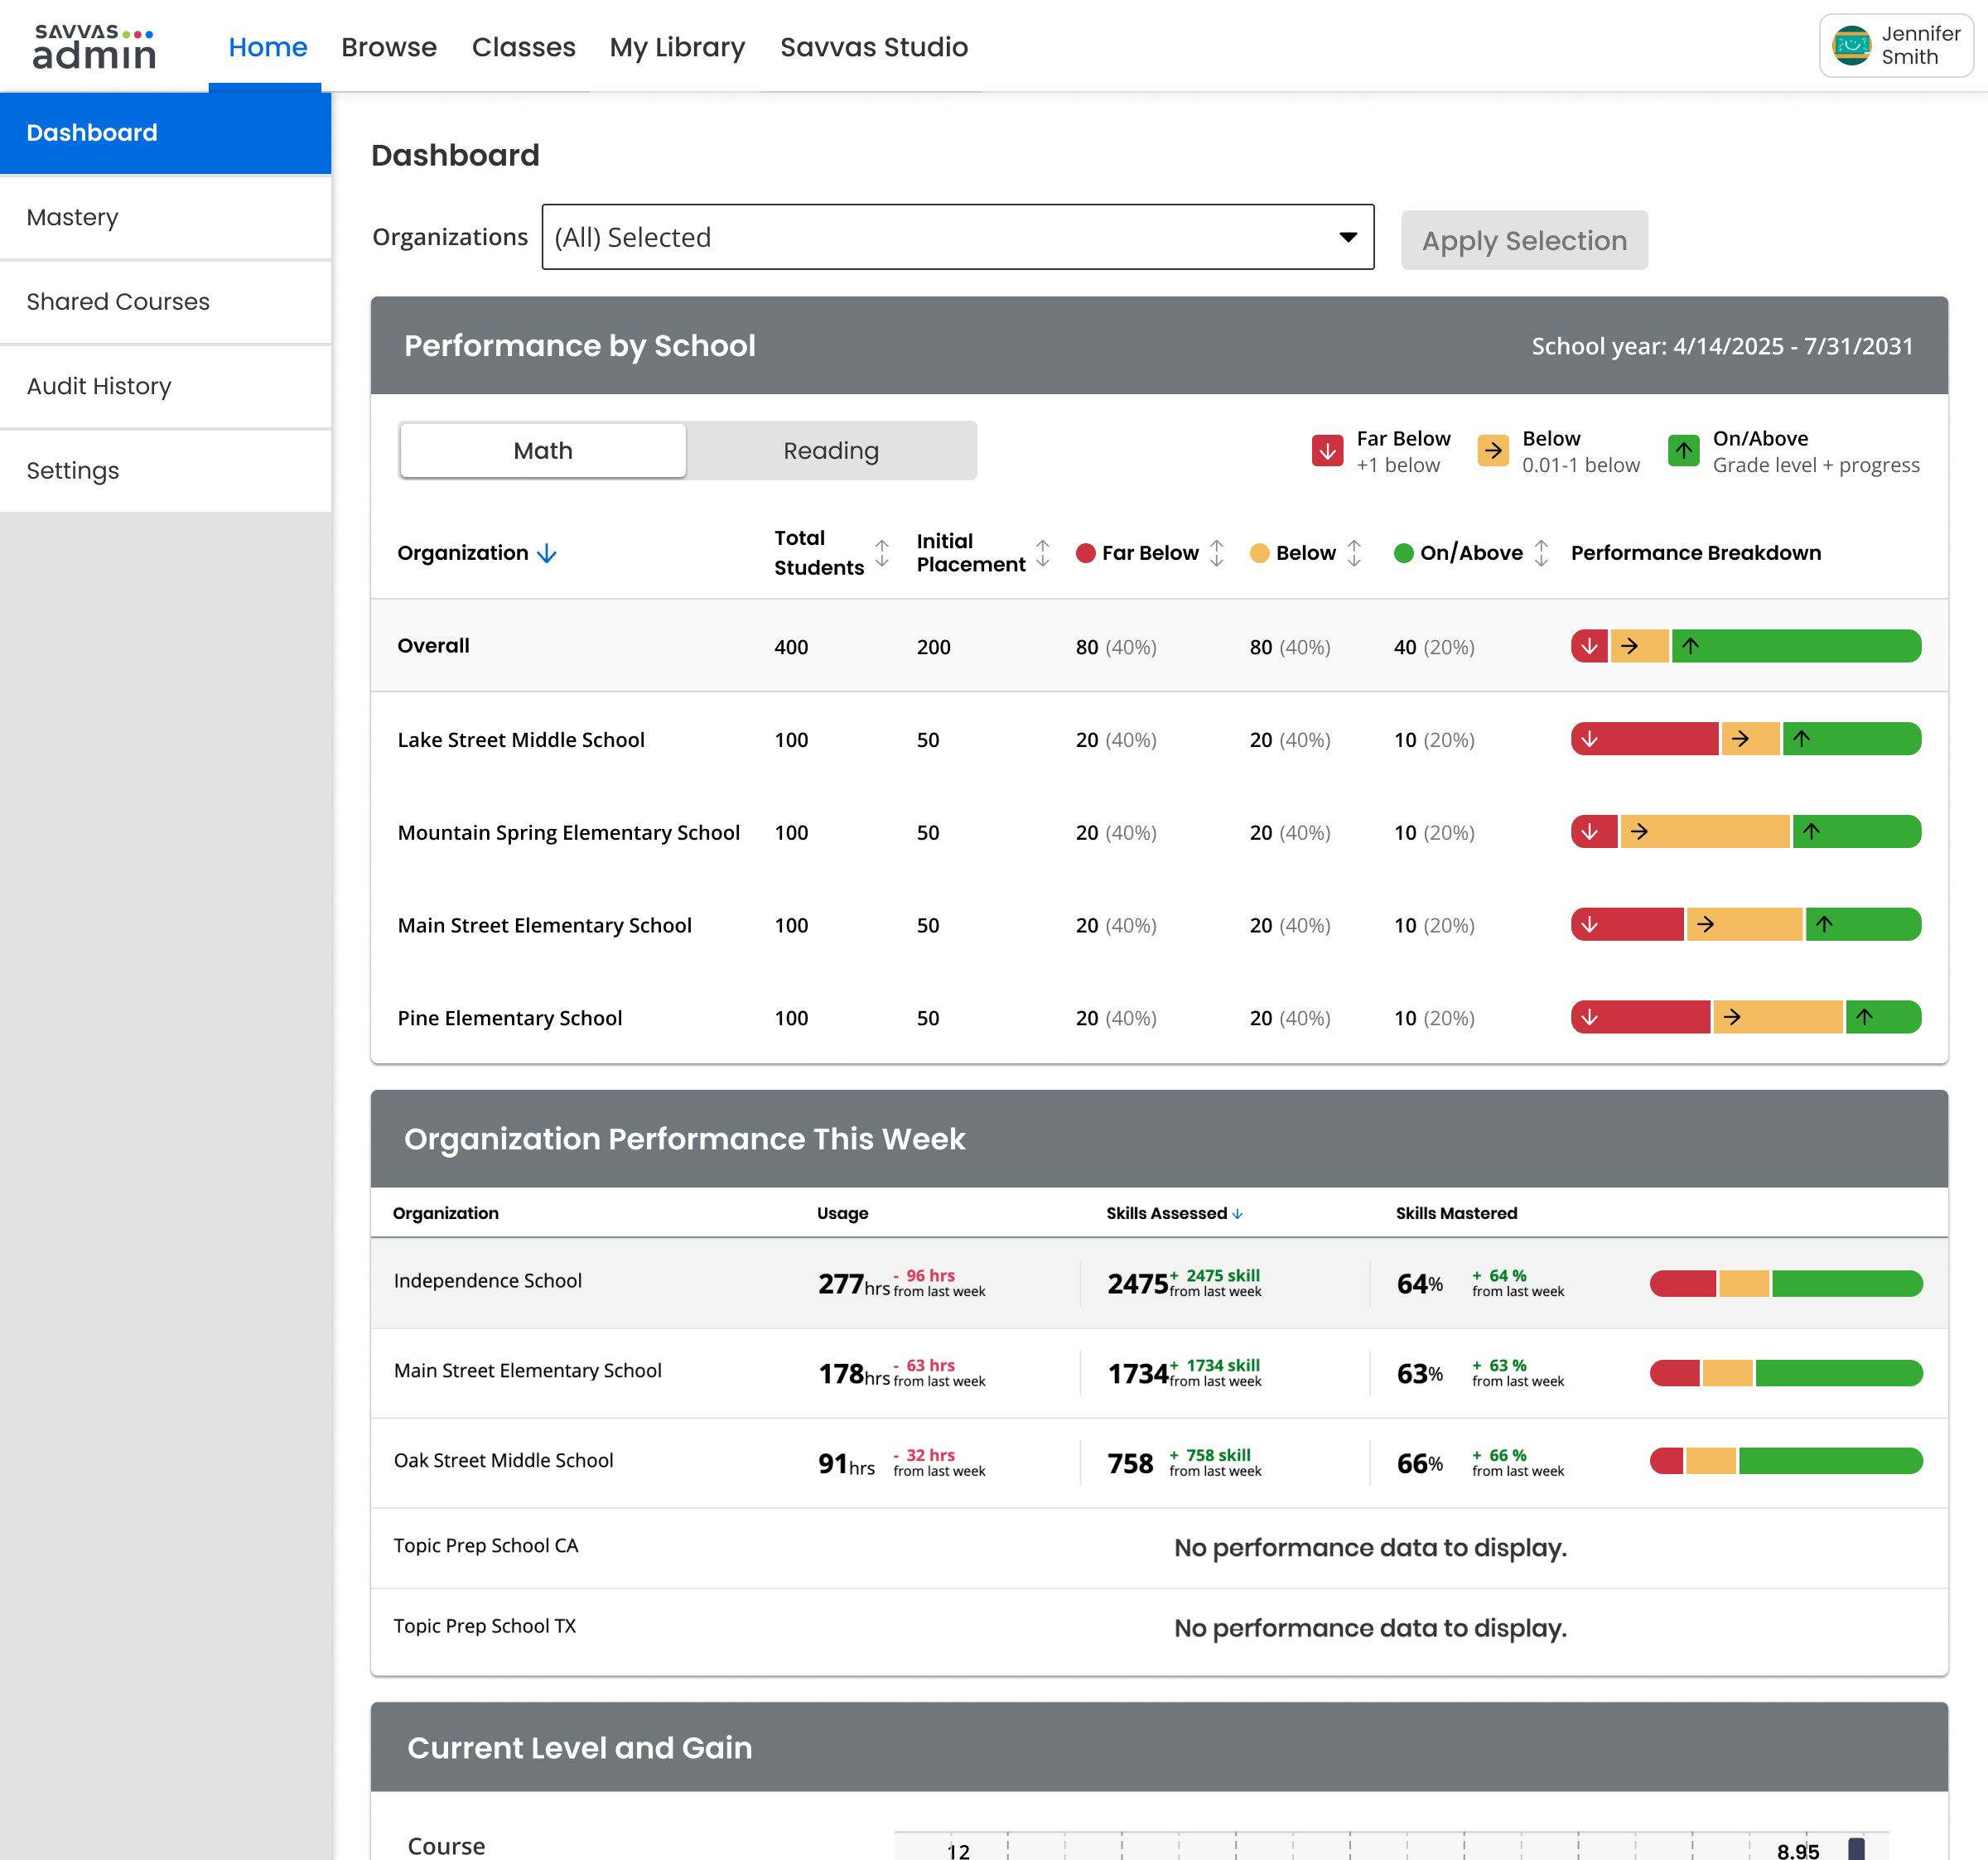
The SuccessMaker Dashboard provides top level intervention information and important notifications for the school or schools for which you're an administrator. The first set of statistics that appears when you navigate to the Dashboard includes Usage, Skills Assessed, and Skills Mastered, organized by school. If you're a school level administrator, you see only information for your school. District administrators see information for all schools in the district. There are three sections on this page.
- Log in and navigate to SuccessMaker. The Dashboard screen appears.
-
Use the Organizations filter to select one or more Organizations to filter all metrics on the dashboard.
Performance by School
The Performance by School feature gives SuccessMaker administrators a new way to monitor student performance directly from the Admin Dashboard. At a glance, you can see how students across your schools are progressing relative to grade-level expectations — broken down into three performance bands: Far Below, Below, and On/Above — so you can quickly identify where students may need additional support.
This feature includes two connected views:
-
Performance by School widget — A dashboard-level summary showing aggregated student counts and performance distributions for each school in your administrative scope. You can toggle between Math and Reading, sort by any column, and see a visual breakdown of performance across schools.
-
Student Details page — Click on various data points on the widget to drill down into the individual students behind that number. From there you can filter by grade, teacher, group, IP status, usage, and performance band; sort by any column; search for specific students; and export your results to CSV.
Performance is calculated based on academic year dates set by the district administrator. A student's rating reflects their current course level compared to where they are expected to be at this point in the school year. Students must complete Initial Placement before performance and gain data become available.
Organization Performance This Week
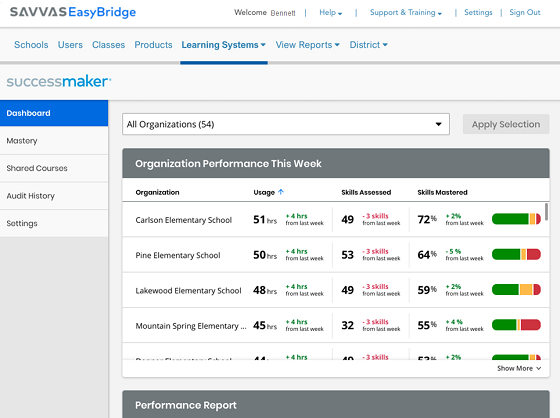
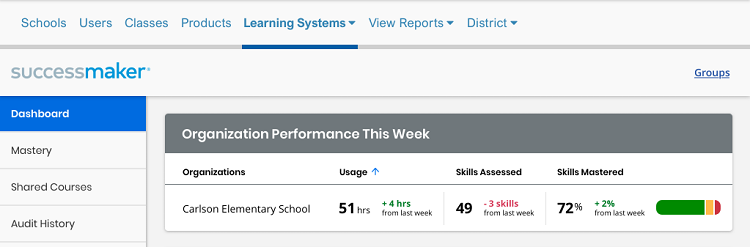
This section provides statistics for the current week. It includes usage for specific organizations within a district, the skills assessed in comparison to the previous week, and the skill mastered as compared to the previous week. Select a specific organization to view.
Performance Report
The performance report in the SuccessMaker Dashboard provides a visual representation of all grades and their current levels, including gains. This graphic is a snapshot for both Math and Reading, providing statistics for the grade level that had the largest gain in levels for the subject and the grade level that had the smallest gain in level for that subject.
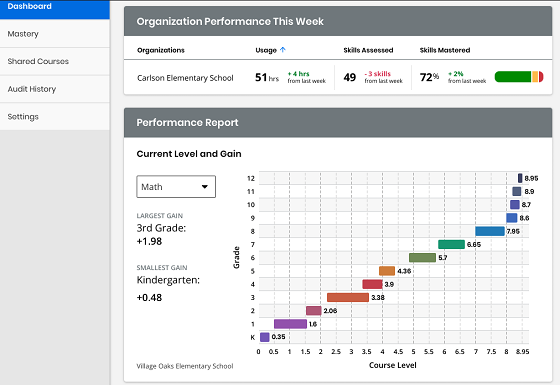
Toggle between Math and Reading to understand where students are succeeding within the selected organization.
Organization Usage
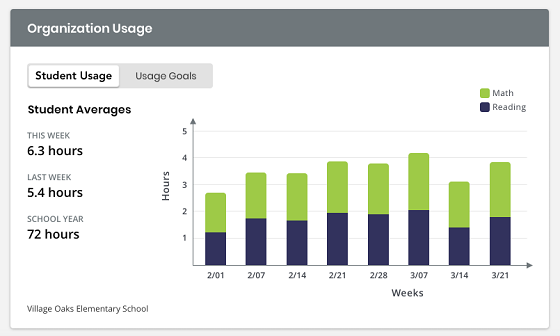
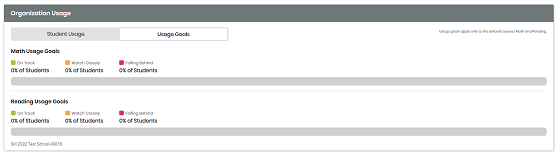
Understand how your students and teachers are using SuccessMaker with the Organization Usage section under Dashboards. The usage is broken out by Student Usage and Usage Goals. The Organization Usage charts are not available for enVision+ Math-only users.
- Student Usage provides average usage by students for the week, along with the averages for last week, broken out on the bar chart by Math and Reading. The total number of cumulative hours for the school year is displayed in this section.

- Usage Goals shows a bar chart of the selected organizations that are on track with their progress, those organizations that need to be watched closely, and the organizations that are falling behind their usage goals.