Monitor Student Progress
This interactive Progress graph shows the student's progress (gain) over time against the student's target levels so you can follow their performance through the year for default Math and Reading courses or custom courses based on settings.
View the Progress Graph
To view the Progress graph, select Courseware in the menu bar, select Assignments, and then select View Assignment next to the assignment you want to view. Select the plus icon to the left of the student.
The Progress graph displays in the right panel.
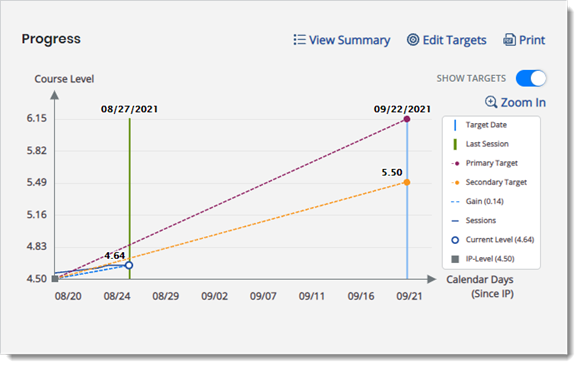
Student sessions are represented by a solid blue line in the graph. You can use the following features to interact with the graph to view session details for the Initial Placement (when IP is Off), or the IP level (when IP is On), the Current level, and the Session level.
-
Select View Summary to see the progress data in a summary view.
-
Select View Graph when in the summary view to return to the graph.
-
Select Edit Targets to change a student's target or target date.
-
Select the components in the graph's legend to show or hide them in the graph.
-
To view the session details for each session, move the mouse pointer over the blue Sessions line. As you point to sections of the line, a blue dot and details appear for each session date.
-
Select the SHOW TARGETS toggle to hide or display target information.
-
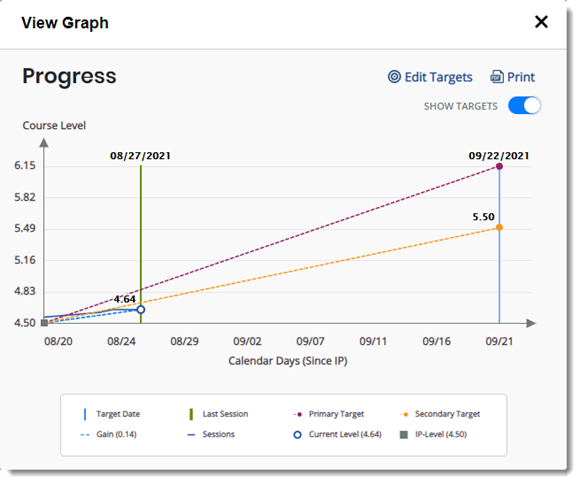
Select Zoom In to see a larger version of the graph. Select the X to close the zoomed in view.

-
Select Print to open a printable PDF of the student's progress.
See Also