Class Summary for Diagnostic Assessments
If you are subscribed to a Momentum Math or Momentum Literacy product (e.g. Math Screener and Diagnostic or Literacy Screener and Diagnostic Assessments), the Class Summary tab provides you with performance data for any of the completed diagnostic assessments.
-
View the data in the Class Summary tab.
-
The Class Performance by Domain chart displays:
-
National Percentile - The student's national percentile ranking for the assessment.
-
Overall Score (Scale Score) - The average of all scale scores of all students who have completed the assessment.
-
Scale Score Example: A score of 1300 on a Level A Diagnostic (Kindergarten) means roughly the same as a score of 1300 on a Level B Diagnostic (Grade 1). So, if a student scored a 1300 in Kindergarten and a 1350 in Grade 1, we can say that their math achievement increased by 50 scale score points.
-
-
Domain Scale Scores - Each domain score is the average of the domain scores of each student who has completed the assessment. Scores are determined by students' performance on questions aligned to the domain.
-
Overall Average Score - The average of all scale scores of all students who have completed the assessment. A legend shows the score ranges for Exceeds, Meets, Approaching, and Does Not Meet expectations, and the number of students who fall into that performance level for the assessment. Select the link if available to see a list of students in the performance level.
-
-
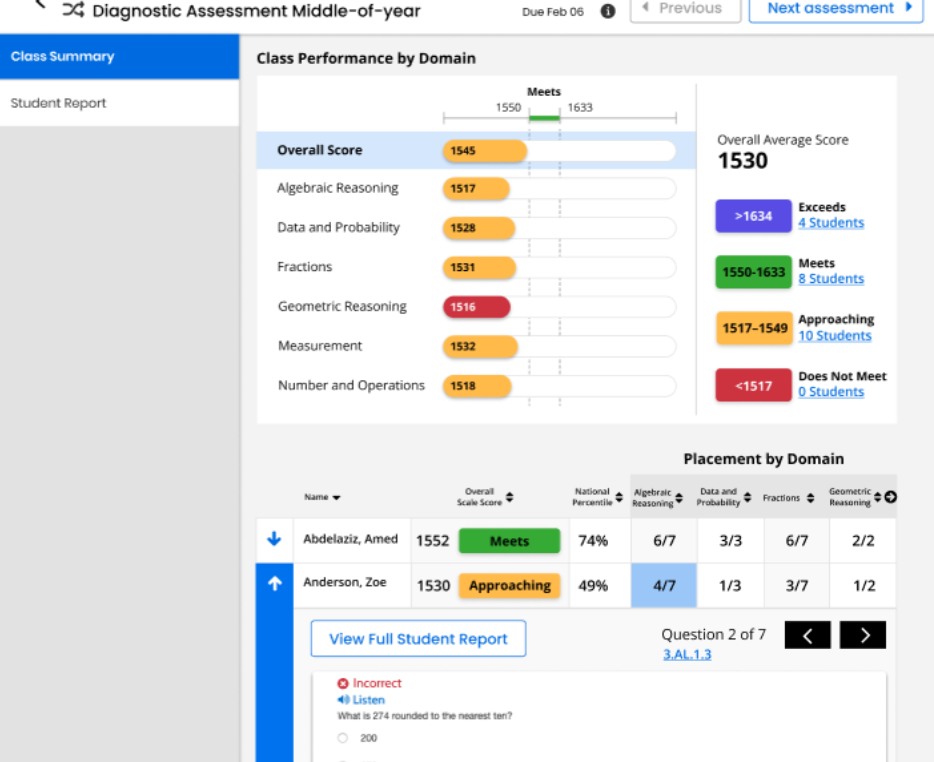
The Placement by Domain table displays:
-
The list of students who have completed the assessment.
-
Overall Scale Score - The student's overall scale score for all domains in the assessment, along with their performance level.
-
National Percentile - The student's national percentile ranking for the assessment.
-
Placement by Domain - The number of correct questions out of the total number of questions for the specified domain in the assessment. Because each student completes a unique assessment, students may have varied numbers of questions per domain.
-
-
-
Select the arrow to the right of the column headers in the students table to view additional domains.

- Select a student's domain score in the table to expand the question view. The numbers in each column represent the number of correct answers out of the number of questions that align to the domain.

Select the domain score to see the series of questions for that domain.
Select the arrows to view additional questions.
Select the standard code link to view standards aligned with the question.
Select the View Full Student Report button to see the Student Report.
Select the up arrow to close the detail view.
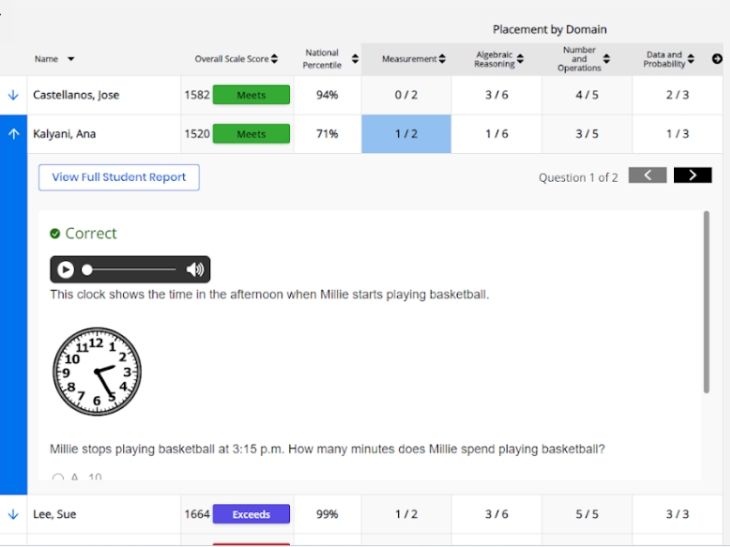

Quantile Measures
If available, Quantile measures place students and math skills on the same scale, indicating a student’s mathematical readiness and the difficulty of specific skills or concepts. Momentum reports Quantile measures in both Diagnostic and Growth Reports. Educators can use the skills database on the Quantile Hub (by MetaMetrics®) to look up measures aligned to any state standard. Comparing a student’s Quantile measure to a skill’s Quantile measure supports data-informed instruction. Close matches suggest appropriate next steps, while larger gaps point to needed scaffolds or enrichment.
To access Quantile measurements, select the Quantile measure tab. You can see an example of the Quantile measure tab below:
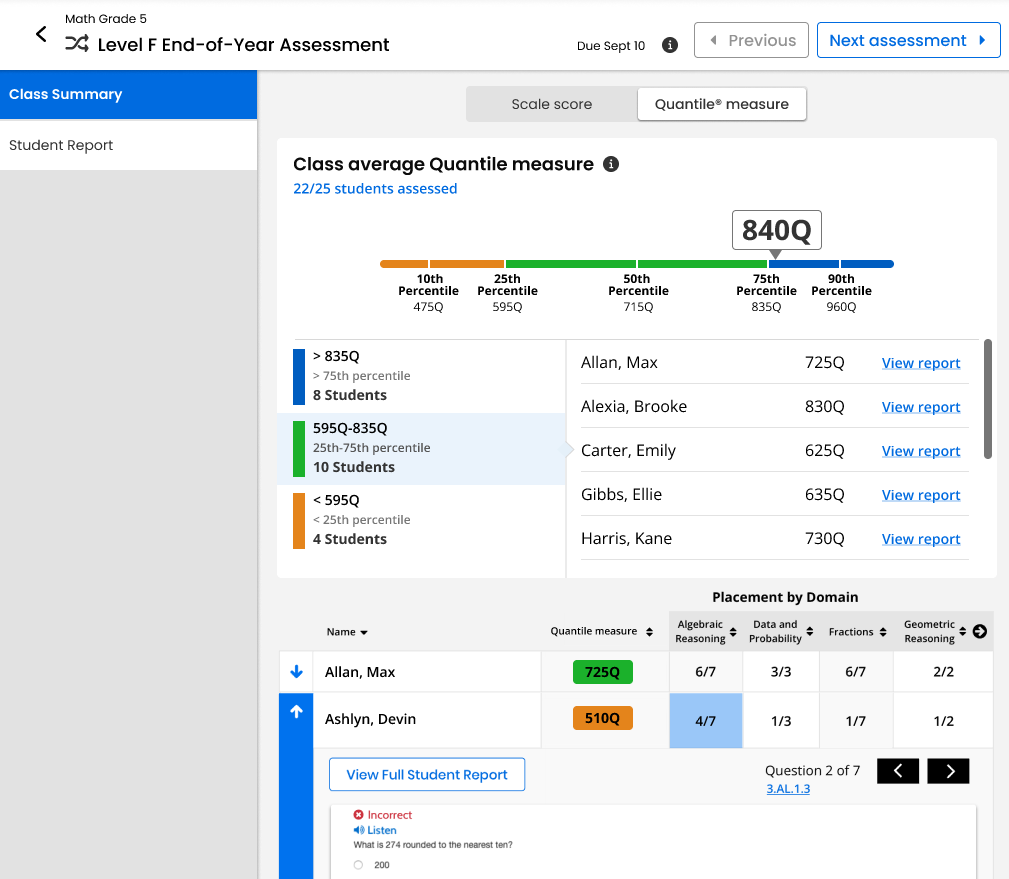
There are two panels worth noting here: Class Average Quantile Measure and Placement by Domain. The Class Average Quantile Measure depicts the class average Quantile measure, with detailed sorting of your students in percentiles based off of their Quantile measure. A Quantile measure is represented by a number followed by a Q, such as 840Q. Additionally, measures lower than 0Q are preceded by EM, or Emerging Mathematician, such as EM300Q. The Placement by Domain panel organizes your students according to their Quantile measure in different domains of math comprehension and performance. You can drill down deeper into each student by pressing the arrow button to the left of each name. You can also filter students by name, by Quantile measure, and by domain by pressing the up and down arrows to the right of each level name.
For more information about Quantile measurements, see the Lexile® and Quantile Hub webpage.
See Also